Matplotlib’s Plot Objects
Plot objects of the matplotlib backend.
Classes:
|
A class for plotting a body in 3D using matplotlib. |
|
A class for plotting a ReferenceFrame in 3D using matplotlib. |
|
A class for plotting lines in 3D using matplotlib. |
|
A class for plotting a Point in 3D using matplotlib. |
|
A class for plotting a traced Point in 3D using matplotlib. |
|
A class for plotting a Vector in 3D using matplotlib. |
- class symmeplot.matplotlib.plot_objects.PlotBody(inertial_frame: ReferenceFrame, zero_point: Point, body: Particle | RigidBody, name: str | None = None, style: str = 'default', plot_point_properties: dict | None = None, plot_frame_properties: dict | None = None, **kwargs: object)
Bases:
PlotBodyMixin,MplPlotBaseA class for plotting a body in 3D using matplotlib.
- Parameters:
inertial_frame (
sympy.physics.vector.frame.ReferenceFrame) – The reference frame with respect to which the object is oriented.zero_point (
sympy.physics.vector.point.Point) – The absolute origin with respect to which the object is positioned.body (
sympy.physics.mechanics.rigidbody.RigidBodyorsympy.physics.mechanics.particle.Particle) – The body that should be plotted.origin (
sympy.physics.vector.point.Pointorsympy.physics.vector.vector.Vector, optional) – The origin of the frame with respect to thezero_point. If asympy.physics.vector.vector.Vectoris provided theoriginis at the tip of the vector with respect to thezero_point. Default iszero_point.style (
str, optional) – Reference to what style should be used for plotting the body. The default style is'default'. Available styles: - None: No properties of the vectors will be set. - ‘default’: Uses a special point for the center of mass and a frame with as color ‘rgb’ for xyz.plot_frame_properties (
dict, optional) – Dictionary of keyword arguments that should be parsed to thesymemplot.matplotlib.plot_objects.PlotFrame.plot_point_properties (
dict, optional) – Dictionary of keyword arguments that should be parsed to thesymemplot.matplotlib.plot_objects.PlotPointrepresenting the center of mass.**kwargs (
dict, optional) – Kwargs that are parsed to both internally used plot objects.
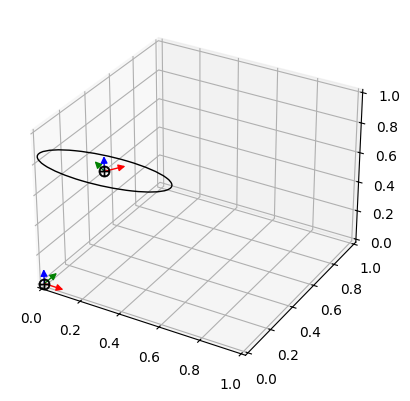
Examples
import matplotlib.pyplot as plt
import sympy as sm
import sympy.physics.mechanics as me
from symmeplot.matplotlib import PlotBody

N = me.ReferenceFrame("N")
A = me.ReferenceFrame("A")
A.orient_axis(N, N.z, 1)
N0 = me.Point("N_0")
A0 = N0.locatenew("A_0", 0.2 * N.x + 0.2 * N.y + 0.7 * N.z)
ground = me.RigidBody("ground", N0, N, 1, (N.x.outer(N.x), N0))
body = me.RigidBody("body", A0, A, 1, (A.x.outer(A.x), A0))
ground_plot = PlotBody(N, N0, ground)
body_plot = PlotBody(N, N0, body)
body_plot.attach_circle(
    body.masscenter, 0.3, A.x + A.y + A.z, facecolor="none", edgecolor="k"
)
fig, ax = plt.subplots(subplot_kw={"projection": "3d"})
ground_plot.values = sm.lambdify((), ground_plot.get_expressions_to_evaluate())()
body_plot.values = sm.lambdify((), body_plot.get_expressions_to_evaluate())()
ground_plot.update()  # Updates the artist(s) to the new values
body_plot.update()  # Updates the artist(s) to the new values
ground_plot.plot(ax)
body_plot.plot(ax)
Methods:
add_artist(artist, exprs)Add an artist to the plot object.
attach_circle(center, radius, normal, **kwargs)Attaches a circle to a point to represent the body.
contains(event)Boolean whether one of the artists contains the event.
Return a tuple of the necessary expressions for plotting.
Return the expressions used in plotting the sympy object.
plot([ax])Plot the associated plot objects.
update()Update the objects on the scene, based on the current values.
Attributes:
Coordinate where the annotation text is displayed.
Artists used to plot the object.
The sympy body, which is being plotted.
Child objects in the plot hierarchy.
The reference frame with respect to which the object is oriented.
Name of the plot object.
PlotFrame used for plotting the reference frame of the body.
PlotPoint used for plotting the center of mass of the body.
The absolute origin with respect to which the object is positioned.
List of evaluated values for the object's variables.
If the object is be visible in the plot.
The absolute origin with respect to which the object is positioned.
- add_artist(artist: ArtistBase, exprs: Expr | tuple[Expr, ...]) None
Add an artist to the plot object.
- Parameters:
artist (
ArtistBase) – The artist to be added.exprs (
expressionortupleofexpressions) – Args used to update the artist in the form of expressions.
- property artists: tuple[ArtistBase, ...]
Artists used to plot the object.
- attach_circle(center: Point | Vector, radius: Expr, normal: Vector, **kwargs: object) Circle3D
Attaches a circle to a point to represent the body.
- Parameters:
center (
sympy.physics.vector.point.Pointorsympy.physics.vector.vector.Vector) – Center of the circle.radius (
Sympifyable) – Radius of the circle.normal (
sympy.physics.vector.vector.Vector) – Normal of the circle.kwargs (
dict) – Key word arguments are parsed tosymmeplot.matplotlib.plot_artists.Circle3D.
- Returns:
Circle artist.
- Return type:
symmeplot.matplotlib.plot_artists.Circle3D
- property body: Particle | RigidBody
The sympy body, which is being plotted.
- contains(event: MouseEvent) bool
Boolean whether one of the artists contains the event.
- get_expressions_to_evaluate() tuple
Return a tuple of the necessary expressions for plotting.
- get_sympy_object_exprs() tuple[Any, ...]
Return the expressions used in plotting the sympy object.
- property inertial_frame: sympy.physics.vector.frame.ReferenceFrame
The reference frame with respect to which the object is oriented.
- property name: str
Name of the plot object. Default is the name of the object being plotted.
- plot(ax: Axes | None = None) None
Plot the associated plot objects.
Explanation
Add the objects artists to the matplotlib axes. Note that the object should be evaluated before plotting.
- Parameters:
ax (
matplotlib.axes._subplots.Axes3DSubplot, optional) – Axes on which the artist should be added. The default is the active axes.
- property sympy_object: object
The absolute origin with respect to which the object is positioned.
- update() None
Update the objects on the scene, based on the current values.
- property values: tuple
List of evaluated values for the object’s variables.
- property visible: bool
If the object is be visible in the plot.
- property zero_point: sympy.physics.vector.point.Point
The absolute origin with respect to which the object is positioned.
- class symmeplot.matplotlib.plot_objects.PlotFrame(inertial_frame: ReferenceFrame, zero_point: Point, frame: ReferenceFrame, origin: Point | Vector | None = None, name: str | None = None, scale: float = 0.1, style: str = 'default', **kwargs: object)
Bases:
PlotFrameMixin,MplPlotBaseA class for plotting a ReferenceFrame in 3D using matplotlib.
- Parameters:
inertial_frame (
sympy.physics.vector.frame.ReferenceFrame) – The reference frame with respect to which the object is oriented.zero_point (
sympy.physics.vector.point.Point) – The absolute origin with respect to which the object is positioned.frame (
sympy.physics.vector.frame.ReferenceFrame) – The reference frame that should be plotted.origin (
sympy.physics.vector.point.Pointorsympy.physics.vector.vector.Vector, optional) – The origin of the frame with respect to thezero_point. If asympy.physics.vector.vector.Vectoris provided the origin is at the tip of the vector with respect to thezero_point. Default iszero_point.style (
str, optional) – Reference to what style should be used for plotting the frame. The default style is'default'. Available styles: - None: No properties of the vectors will be set. - ‘default’: Nice default frame with as color ‘rgb’ for xyz.scale (
float, optional) – Length of the vectors of the reference frame.**kwargs (
dict, optional) – Kwargs that are parsed tosymmeplot.matplotlib.plot_objects.PlotVector`s, which possibly parses them to :class:`matplotlib.patches.FancyArrow, socolor='r'will make all vectors of the reference frame red.
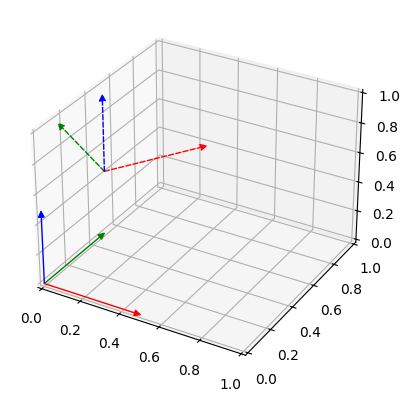
Examples
import matplotlib.pyplot as plt
import sympy as sm
import sympy.physics.mechanics as me
from symmeplot.matplotlib import PlotFrame

N = me.ReferenceFrame("N")
A = me.ReferenceFrame("A")
A.orient_axis(N, N.z, 1)
N0 = me.Point("N_0")
A0 = N0.locatenew("A_0", 0.2 * N.x + 0.2 * N.y + 0.7 * N.z)
N_plot = PlotFrame(N, N0, N, scale=0.5)
A_plot = PlotFrame(N, N0, A, A0, scale=0.5, ls="--")
fig, ax = plt.subplots(subplot_kw={"projection": "3d"})
N_plot.values = sm.lambdify((), N_plot.get_expressions_to_evaluate())()
A_plot.values = sm.lambdify((), A_plot.get_expressions_to_evaluate())()
N_plot.update()  # Updates the artist(s) to the new values
A_plot.update()  # Updates the artist(s) to the new values
N_plot.plot(ax)
A_plot.plot(ax)
Methods:
add_artist(artist, exprs)Add an artist to the plot object.
contains(event)Boolean whether one of the artists contains the event.
Return a tuple of the necessary expressions for plotting.
Get coordinate of the origin as expressions.
plot([ax])Plot the associated plot objects.
update()Update the objects on the scene, based on the current values.
Attributes:
Coordinate where the annotation text is displayed.
Artists used to plot the object.
Child objects in the plot hierarchy.
The sympy ReferenceFrame, which is being plotted.
The reference frame with respect to which the object is oriented.
Name of the plot object.
The origin of the object with respect to the zero_point.
The absolute origin with respect to which the object is positioned.
List of evaluated values for the object's variables.
The PlotVectors used to plot the reference frame.
If the object is be visible in the plot.
PlotVector used for the unit vector in the x direction.
PlotVector used for the unit vector in the y direction.
PlotVector used for the unit vector in the z direction.
The absolute origin with respect to which the object is positioned.
- add_artist(artist: ArtistBase, exprs: Expr | tuple[Expr, ...]) None
Add an artist to the plot object.
- Parameters:
artist (
ArtistBase) – The artist to be added.exprs (
expressionortupleofexpressions) – Args used to update the artist in the form of expressions.
- property artists: tuple[ArtistBase, ...]
Artists used to plot the object.
- contains(event: MouseEvent) bool
Boolean whether one of the artists contains the event.
- property frame: sympy.physics.vector.frame.ReferenceFrame
The sympy ReferenceFrame, which is being plotted.
- get_expressions_to_evaluate() tuple
Return a tuple of the necessary expressions for plotting.
- property inertial_frame: sympy.physics.vector.frame.ReferenceFrame
The reference frame with respect to which the object is oriented.
- property name: str
Name of the plot object. Default is the name of the object being plotted.
- property origin: sympy.physics.vector.point.Point
The origin of the object with respect to the zero_point.
- plot(ax: Axes | None = None) None
Plot the associated plot objects.
Explanation
Add the objects artists to the matplotlib axes. Note that the object should be evaluated before plotting.
- Parameters:
ax (
matplotlib.axes._subplots.Axes3DSubplot, optional) – Axes on which the artist should be added. The default is the active axes.
- property sympy_object: object
The absolute origin with respect to which the object is positioned.
- update() None
Update the objects on the scene, based on the current values.
- property values: tuple
List of evaluated values for the object’s variables.
- property vectors: tuple[PlotBase, PlotBase, PlotBase]
The PlotVectors used to plot the reference frame.
- property visible: bool
If the object is be visible in the plot.
- property zero_point: sympy.physics.vector.point.Point
The absolute origin with respect to which the object is positioned.
- class symmeplot.matplotlib.plot_objects.PlotLine(inertial_frame: ReferenceFrame, zero_point: Point, line: Iterable[Point], name: str | None = None, **kwargs: object)
Bases:
PlotLineMixin,MplPlotBaseA class for plotting lines in 3D using matplotlib.
- Parameters:
inertial_frame (
sympy.physics.vector.frame.ReferenceFrame) – The reference frame with respect to which the object is oriented.zero_point (
sympy.physics.vector.point.Point) – The absolute origin with respect to which the object is positioned.points (
listofsympy.physics.vector.point.Pointorsympy.physics.vector.vector.Vector) – The points or vectors through which the line should be plotted with respect to thezero_point. If a vector is provided, theoriginwill be at the tip of the vector with respect to thezero_point.name (
str, optional) – The name of the line. Default isNone.**kwargs (
dict, optional) – Kwargs that are parsed tompl_toolkits.mplot3d.art3d.Line3D, socolor='r'will make the plotted line red.
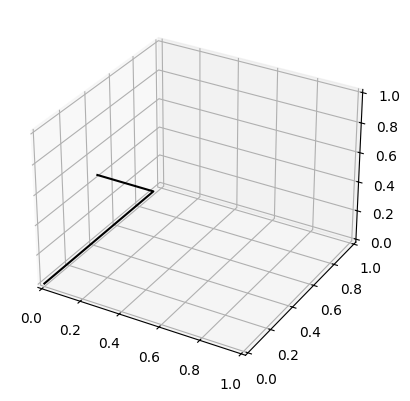
Examples
import matplotlib.pyplot as plt
import sympy as sm
import sympy.physics.mechanics as me
from symmeplot.matplotlib import PlotLine

l1, l2, l3 = sm.symbols("l:3")
N, O = me.ReferenceFrame("N"), me.Point("O")
P1 = O.locatenew("P1", (l1 * N.x + l2 * N.y + l3 * N.z))
P2 = P1.locatenew("P2", -0.3 * N.x)
fig, ax = plt.subplots(subplot_kw={"projection": "3d"})
line_plot = PlotLine(N, O, [O, P1, P2], color="k")
f = sm.lambdify((l1, l2, l3), line_plot.get_expressions_to_evaluate())
line_plot.values = f(0, 0, 0)
line_plot.update()  # Updates the artist(s) to the new values
line_plot.plot()  # Plot the point
line_plot.values = f(0.2, 0.6, 0.3)
line_plot.update()  # The point will now be on its new position
Methods:
add_artist(artist, exprs)Add an artist to the plot object.
contains(event)Boolean whether one of the artists contains the event.
Return a tuple of the necessary expressions for plotting.
Arguments of the sympy object artist in expression form.
plot([ax])Plot the associated plot objects.
update()Update the objects on the scene, based on the current values.
Attributes:
Coordinate where the annotation text is displayed.
Artists used to plot the object.
Child objects in the plot hierarchy.
The reference frame with respect to which the object is oriented.
The points that spawn the line.
Coordinate values of the plotted line.
Name of the plot object.
The absolute origin with respect to which the object is positioned.
List of evaluated values for the object's variables.
If the object is be visible in the plot.
The absolute origin with respect to which the object is positioned.
- add_artist(artist: ArtistBase, exprs: Expr | tuple[Expr, ...]) None
Add an artist to the plot object.
- Parameters:
artist (
ArtistBase) – The artist to be added.exprs (
expressionortupleofexpressions) – Args used to update the artist in the form of expressions.
- property artists: tuple[ArtistBase, ...]
Artists used to plot the object.
- contains(event: MouseEvent) bool
Boolean whether one of the artists contains the event.
- get_expressions_to_evaluate() tuple
Return a tuple of the necessary expressions for plotting.
- get_sympy_object_exprs() tuple[tuple[Expr, ...], tuple[Expr, ...], tuple[Expr, ...]]
Arguments of the sympy object artist in expression form.
Notes
The form of the expression is
((x0, x1, ...), (y0, y1, ...), (z0, z1, ...)).
- property inertial_frame: sympy.physics.vector.frame.ReferenceFrame
The reference frame with respect to which the object is oriented.
- property line: tuple[sympy.physics.vector.point.Point, ...]
The points that spawn the line.
- property name: str
Name of the plot object. Default is the name of the object being plotted.
- plot(ax: Axes | None = None) None
Plot the associated plot objects.
Explanation
Add the objects artists to the matplotlib axes. Note that the object should be evaluated before plotting.
- Parameters:
ax (
matplotlib.axes._subplots.Axes3DSubplot, optional) – Axes on which the artist should be added. The default is the active axes.
- property sympy_object: object
The absolute origin with respect to which the object is positioned.
- update() None
Update the objects on the scene, based on the current values.
- property values: tuple
List of evaluated values for the object’s variables.
- property visible: bool
If the object is be visible in the plot.
- property zero_point: sympy.physics.vector.point.Point
The absolute origin with respect to which the object is positioned.
- class symmeplot.matplotlib.plot_objects.PlotPoint(inertial_frame: sympy.physics.vector.frame.ReferenceFrame, zero_point: sympy.physics.vector.point.Point, point: sympy.physics.vector.point.Point, name: str | None = None, style: str = 'default', **kwargs: object)
Bases:
PlotPointMixin,MplPlotBaseA class for plotting a Point in 3D using matplotlib.
- Parameters:
inertial_frame (
sympy.physics.vector.frame.ReferenceFrame) – The reference frame with respect to which the object is oriented.zero_point (
sympy.physics.vector.point.Point) – The absolute origin with respect to which the object is positioned.point (
sympy.physics.vector.point.Pointorsympy.physics.vector.vector.Vector) – The point or vector that should be plotted with respect to thezero_point. If a vector is provided, theoriginwill be at the tip of the vector with respect to thezero_point. If not specified, the default is thezero_point.style (
str, optional) – Reference to what style should be used for plotting the point. The default style is'default'. Available styles: - None: Default of thempl_toolkits.mplot3d.art3d.Line3D. - ‘default’: Normal point.**kwargs (
dict, optional) – Kwargs that are parsed tompl_toolkits.mplot3d.art3d.Line3D, socolor='r'will make the plotted point red.
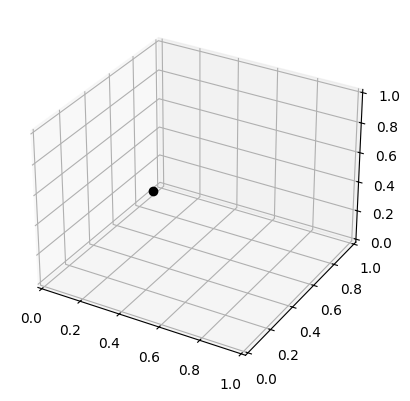
Examples
import matplotlib.pyplot as plt
import sympy as sm
import sympy.physics.mechanics as me
from symmeplot.matplotlib import PlotPoint

l1, l2, l3 = sm.symbols("l:3")
N, O = me.ReferenceFrame("N"), me.Point("O")
P1 = O.locatenew("P1", (l1 * N.x + l2 * N.y + l3 * N.z))
fig, ax = plt.subplots(subplot_kw={"projection": "3d"})
plot_point = PlotPoint(N, O, P1, color="k")
f = sm.lambdify((l1, l2, l3), plot_point.get_expressions_to_evaluate())
plot_point.values = f(0, 0, 0)
plot_point.update()  # Updates the artist(s) to the new values
plot_point.plot()  # Plot the point
plot_point.values = f(0.2, 0.6, 0.3)
plot_point.update()  # The point will now be on its new position
Methods:
add_artist(artist, exprs)Add an artist to the plot object.
contains(event)Boolean whether one of the artists contains the event.
Return a tuple of the necessary expressions for plotting.
Get coordinate of the point as expressions.
plot([ax])Plot the associated plot objects.
update()Update the objects on the scene, based on the current values.
Attributes:
Coordinate where the annotation text is displayed.
Artists used to plot the object.
Child objects in the plot hierarchy.
The reference frame with respect to which the object is oriented.
Name of the plot object.
The sympy Point, which is being plotted.
Coordinate values of the plotted point.
The absolute origin with respect to which the object is positioned.
List of evaluated values for the object's variables.
If the object is be visible in the plot.
The absolute origin with respect to which the object is positioned.
- add_artist(artist: ArtistBase, exprs: Expr | tuple[Expr, ...]) None
Add an artist to the plot object.
- Parameters:
artist (
ArtistBase) – The artist to be added.exprs (
expressionortupleofexpressions) – Args used to update the artist in the form of expressions.
- property artists: tuple[ArtistBase, ...]
Artists used to plot the object.
- contains(event: MouseEvent) bool
Boolean whether one of the artists contains the event.
- get_expressions_to_evaluate() tuple
Return a tuple of the necessary expressions for plotting.
- property inertial_frame: sympy.physics.vector.frame.ReferenceFrame
The reference frame with respect to which the object is oriented.
- property name: str
Name of the plot object. Default is the name of the object being plotted.
- plot(ax: Axes | None = None) None
Plot the associated plot objects.
Explanation
Add the objects artists to the matplotlib axes. Note that the object should be evaluated before plotting.
- Parameters:
ax (
matplotlib.axes._subplots.Axes3DSubplot, optional) – Axes on which the artist should be added. The default is the active axes.
- property point: sympy.physics.vector.point.Point
The sympy Point, which is being plotted.
- property sympy_object: object
The absolute origin with respect to which the object is positioned.
- update() None
Update the objects on the scene, based on the current values.
- property values: tuple
List of evaluated values for the object’s variables.
- property visible: bool
If the object is be visible in the plot.
- property zero_point: sympy.physics.vector.point.Point
The absolute origin with respect to which the object is positioned.
- class symmeplot.matplotlib.plot_objects.PlotTracedPoint(inertial_frame: ReferenceFrame, zero_point: Point, point: Point, name: str | None = None, frequency: int = 1, alpha_decays: Callable[[np.ndarray[np.int64]], np.ndarray[np.float64]] | None = None, **kwargs: object)
Bases:
PlotTracedPointMixin,MplPlotBaseA class for plotting a traced Point in 3D using matplotlib.
- Parameters:
inertial_frame (
sympy.physics.vector.frame.ReferenceFrame) – The reference frame with respect to which the object is oriented.zero_point (
sympy.physics.vector.point.Point) – The absolute origin with respect to which the object is positioned.point (
sympy.physics.vector.point.Point) – The point that should be traced with respect to thezero_point.name (
str, optional) – Name of the plot object.frequency (
int, optional) – Frequency to log the point with. Default is 1 (shows every point).alpha_decays (
callable, optional) – Function that returns the transparency of a point based on the number of evaluations since it was logged. This input is an array of integers representing the age of each logged point, and the output should be an array of floats between 0 and 1 representing the alpha values. If None, no transparency decay is applied. Default is None. Hint: you can use np.vectorize to vectorize a function for this purpose.color (
str, optional) – Color of the traced points. Default is ‘C0’.**kwargs (
dict, optional) – Kwargs that are parsed toScatter3D(which inherits from Path3DCollection), e.g.facecolors,edgecolors,linewidths.
Examples
import matplotlib.pyplot as plt
import numpy as np
import sympy as sm
import sympy.physics.mechanics as me
from symmeplot.matplotlib import PlotTracedPoint

t = sm.symbols("t")
N, O = me.ReferenceFrame("N"), me.Point("O")
P = O.locatenew("P", sm.cos(t) * N.x + sm.sin(t) * N.y)
fig, ax = plt.subplots(subplot_kw={"projection": "3d"})
plot_traced = PlotTracedPoint(
    N,
    O,
    P,
    frequency=1,
    alpha_decays=lambda i: np.maximum(0.1, 1.0 - i / 20),
)
f = sm.lambdify(t, plot_traced.get_expressions_to_evaluate())
for t_val in np.linspace(0, 2 * np.pi, 30):
    plot_traced.values = f(t_val)
    plot_traced.update()
plot_traced.plot(ax)
Methods:
add_artist(artist, exprs)Add an artist to the plot object.
contains(event)Boolean whether one of the artists contains the event.
Return a tuple of the necessary expressions for plotting.
Get coordinate of the point as expressions.
plot([ax])Plot the traced point.
update()Update the objects on the scene, based on the current values.
Attributes:
Function that returns the transparency based on evaluation count.
Coordinate where the annotation text is displayed.
Artists used to plot the object.
Child objects in the plot hierarchy.
Frequency to log the point with.
The reference frame with respect to which the object is oriented.
Name of the plot object.
The sympy Point, which is being traced.
Coordinate values of the current plotted point.
The absolute origin with respect to which the object is positioned.
History of point positions.
List of evaluated values for the object's variables.
If the object is be visible in the plot.
The absolute origin with respect to which the object is positioned.
- add_artist(artist: ArtistBase, exprs: Expr | tuple[Expr, ...]) None
Add an artist to the plot object.
- Parameters:
artist (
ArtistBase) – The artist to be added.exprs (
expressionortupleofexpressions) – Args used to update the artist in the form of expressions.
- property alpha_decays: Callable[[np.ndarray[np.int64]], np.ndarray[np.float64]]
Function that returns the transparency based on evaluation count.
- property artists: tuple[ArtistBase, ...]
Artists used to plot the object.
- contains(event: MouseEvent) bool
Boolean whether one of the artists contains the event.
- property frequency: int
Frequency to log the point with.
- get_expressions_to_evaluate() tuple
Return a tuple of the necessary expressions for plotting.
- property inertial_frame: sympy.physics.vector.frame.ReferenceFrame
The reference frame with respect to which the object is oriented.
- property name: str
Name of the plot object. Default is the name of the object being plotted.
- plot(ax: Axes | None = None) None
Plot the traced point.
- Parameters:
ax (
matplotlib.axes._subplots.Axes3DSubplot, optional) – Axes on which the artist should be added. The default is the active axes.
- property point: sympy.physics.vector.point.Point
The sympy Point, which is being traced.
- property sympy_object: object
The absolute origin with respect to which the object is positioned.
- update() None
Update the objects on the scene, based on the current values.
- property values: tuple
List of evaluated values for the object’s variables.
- property visible: bool
If the object is be visible in the plot.
- property zero_point: sympy.physics.vector.point.Point
The absolute origin with respect to which the object is positioned.
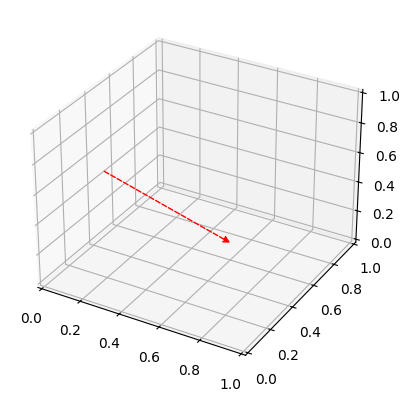
- class symmeplot.matplotlib.plot_objects.PlotVector(inertial_frame: ReferenceFrame, zero_point: Point, vector: Vector, origin: Point | Vector | None = None, name: str | None = None, style: str = 'default', **kwargs: object)
Bases:
PlotVectorMixin,MplPlotBaseA class for plotting a Vector in 3D using matplotlib.
- Parameters:
inertial_frame (
sympy.physics.vector.frame.ReferenceFrame) – The reference frame with respect to which the object is oriented.zero_point (
sympy.physics.vector.point.Point) – The absolute origin with respect to which the object is positioned.vector (
sympy.physics.vector.vector.Vector) – The vector that should be plotted with respect to thezero_point.origin (
sympy.physics.vector.point.Pointorsympy.physics.vector.vector.Vector, optional) – The origin of the vector with respect to thezero_point. If asympy.physics.vector.vector.Vectoris provided theoriginis at the tip of the vector with respect to thezero_point. Default iszero_point.name (
str) – Name of the plot object. Default is the vector as string.style (
str, optional) – Reference to what style should be used for plotting the vector. The default style is'default'. Available styles: - None: Default of thempl_toolkits.mplot3d.art3d.Line3D. - ‘default’: Normal black arrow.**kwargs (
dict, optional) – Kwargs that are parsed tompl_toolkits.mplot3d.art3d.Line3D, socolor='r'will make the plotted arrow red.
Examples
import matplotlib.pyplot as plt
import sympy as sm
import sympy.physics.mechanics as me
from symmeplot.matplotlib import PlotVector

N = me.ReferenceFrame("N")
O = me.Point("O")
O_v = O.locatenew("O_v", 0.2 * N.x + 0.2 * N.y + 0.7 * N.z)
v = 0.4 * N.x + 0.4 * N.y - 0.6 * N.z
v_plot = PlotVector(N, O, v, O_v, color="r", ls="--")
fig, ax = plt.subplots(subplot_kw={"projection": "3d"})
v_plot.values = sm.lambdify((), v_plot.get_expressions_to_evaluate())()
v_plot.update()  # Updates the artist(s) to the new values
v_plot.plot(ax)

Methods:
add_artist(artist, exprs)Add an artist to the plot object.
contains(event)Boolean whether one of the artists contains the event.
Return a tuple of the necessary expressions for plotting.
Arguments of the sympy object artist in expression form.
plot([ax])Plot the associated plot objects.
update()Update the objects on the scene, based on the current values.
Attributes:
Coordinate where the annotation text is displayed.
Artists used to plot the object.
Child objects in the plot hierarchy.
The reference frame with respect to which the object is oriented.
Name of the plot object.
The origin of the object with respect to the zero_point.
Coordinate values of the origin of the plotted vector.
The absolute origin with respect to which the object is positioned.
List of evaluated values for the object's variables.
The sympy Vector, which is being plotted.
Values of the plotted vector.
If the object is be visible in the plot.
The absolute origin with respect to which the object is positioned.
- add_artist(artist: ArtistBase, exprs: Expr | tuple[Expr, ...]) None
Add an artist to the plot object.
- Parameters:
artist (
ArtistBase) – The artist to be added.exprs (
expressionortupleofexpressions) – Args used to update the artist in the form of expressions.
- property artists: tuple[ArtistBase, ...]
Artists used to plot the object.
- contains(event: MouseEvent) bool
Boolean whether one of the artists contains the event.
- get_expressions_to_evaluate() tuple
Return a tuple of the necessary expressions for plotting.
- get_sympy_object_exprs() tuple[tuple[Expr, ...], tuple[Expr, ...]]
Arguments of the sympy object artist in expression form.
- property inertial_frame: sympy.physics.vector.frame.ReferenceFrame
The reference frame with respect to which the object is oriented.
- property name: str
Name of the plot object. Default is the name of the object being plotted.
- property origin: sympy.physics.vector.point.Point
The origin of the object with respect to the zero_point.
- plot(ax: Axes | None = None) None
Plot the associated plot objects.
Explanation
Add the objects artists to the matplotlib axes. Note that the object should be evaluated before plotting.
- Parameters:
ax (
matplotlib.axes._subplots.Axes3DSubplot, optional) – Axes on which the artist should be added. The default is the active axes.
- property sympy_object: object
The absolute origin with respect to which the object is positioned.
- update() None
Update the objects on the scene, based on the current values.
- property values: tuple
List of evaluated values for the object’s variables.
- property vector: sympy.physics.vector.vector.Vector
The sympy Vector, which is being plotted.
- property visible: bool
If the object is be visible in the plot.
- property zero_point: sympy.physics.vector.point.Point
The absolute origin with respect to which the object is positioned.