Matplotlib’s Scene
Definition of the scene for the matplotlib backend.
Classes:
|
Class for plotting sympy mechanics in matplotlib. |
- class symmeplot.matplotlib.scene.Scene3D(inertial_frame: sympy.physics.vector.frame.ReferenceFrame, zero_point: sympy.physics.vector.point.Point, ax: Axes | None = None, **inertial_frame_properties: object)
Bases:
SceneBaseClass for plotting sympy mechanics in matplotlib.
- Parameters:
inertial_frame (
sympy.physics.vector.frame.ReferenceFrame) – The reference frame with respect to which all objects will be oriented.origin (
sympy.physics.vector.point.Point) – The absolute origin with respect to which all objects will be positioned.ax (
mpl_toolkits.mplot3d.axes3d.Axes3D, optional) – Axes on which the sympy mechanics should be plotted.**inertial_frame_properties (
dict, optional) – Keyword arguments are parsed to thesymmeplot.matplotlib.plot_objects.PlotFramerepresenting the inertial reference frame.
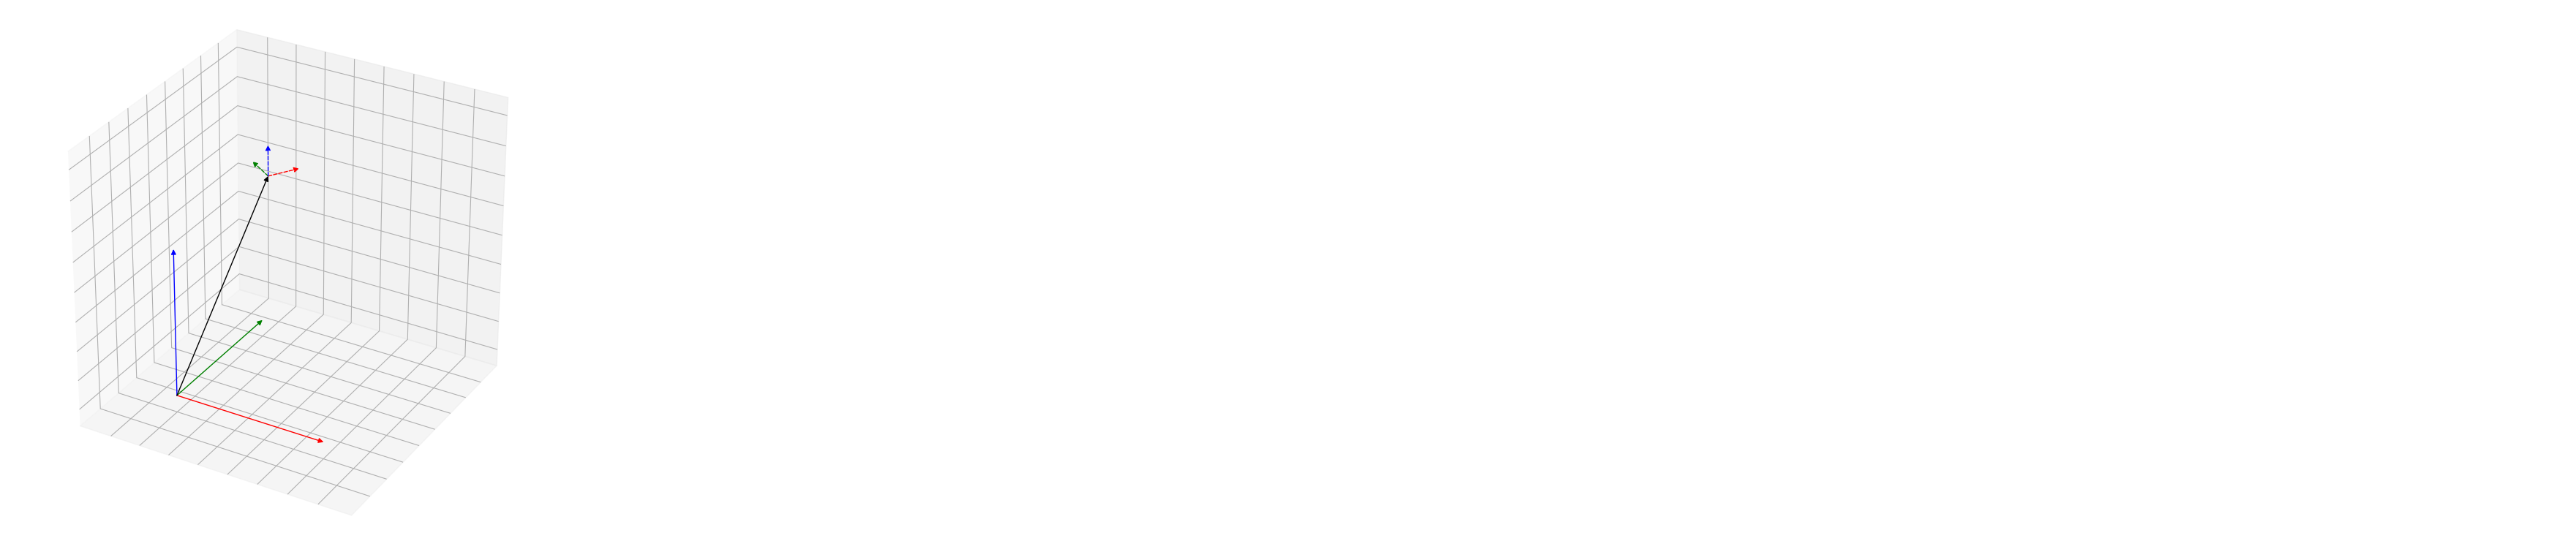
Examples
import matplotlib.pyplot as plt
import sympy.physics.mechanics as me
from symmeplot.matplotlib import Scene3D

N = me.ReferenceFrame("N")
A = me.ReferenceFrame("A")
A.orient_axis(N, N.z, 1)
N0 = me.Point("N_0")
v = 0.2 * N.x + 0.2 * N.y + 0.7 * N.z
A0 = N0.locatenew("A_0", v)
scene = Scene3D(N, N0, scale=0.5)
scene.add_vector(v, name="v")
scene.add_frame(A, A0, ls="--")
scene.lambdify_system(())
scene.evaluate_system()
scene.plot()
Methods:
add_body(body, **kwargs)Add a sympy body to the scene.
add_frame(frame[, origin])Add a sympy ReferenceFrame to the scene.
add_line(points[, name])Add a sympy Vector to the scene.
add_plot_object(plot_object)Add a plot object to the scene.
add_point(point, **kwargs)Add a sympy Vector to the scene.
add_point_trace(point[, frequency, alpha_decays])Add a traced point to the scene.
add_vector(vector[, origin])Add a sympy Vector to the scene.
animate(get_args, frames[, interval])Animate the scene.
as_orthogonal_projection_plot([frame])Change the axis to an orthogonal projection making the view seemingly 2D.
auto_zoom([scale])Auto scale the axis.
clear()Clear the axes.
evaluate_system(*args)Evaluate the system using the function created with
lambdify_system.Return a tuple of the necessary expressions for plotting.
get_plot_object(sympy_object)Return the plot_object based on a sympy object.
lambdify_system(args[, modules, printer, ...])Lambdify the system.
plot([prettify, ax_scale])Plot all plot objects.
set_visibility(sympy_object, is_visible[, ...])Hide or show a
plot_objectbased on asympy_object.update()Update the objects on the scene, based on the current values.
Attributes:
Coordinate where the annotation text is displayed.
String describing where the annotation should be displayed.
Artists used to plot the object.
Axes used by the scene.
Plot objects.
The reference frame with respect to which all objects will be oriented.
Plot objects.
List of evaluated values for the object's variables.
The absolute origin with respect to which all objects will be positioned.
- add_body(body: Particle | RigidBody, **kwargs: object) PlotBase
Add a sympy body to the scene.
- Parameters:
body (
sympy.physics.mechanics.rigidbody.RigidBodyorsympy.physics.mechanics.particle.Particle) – The body that should be plotted.**kwargs (
dict, optional) – Kwargs that are parsed to both internally used plot objects.
- Returns:
The added plot object.
- Return type:
PlotBody
- add_frame(frame: ReferenceFrame, origin: Point | Vector | None = None, **kwargs: object) PlotBase
Add a sympy ReferenceFrame to the scene.
- Parameters:
frame (
sympy.physics.vector.frame.ReferenceFrame) – The reference frame that should be plotted.origin (
sympy.physics.vector.point.Point,sympy.physics.vector.vector.Vector, optional) – The origin of the reference frame. Default is the zero_point.**kwargs (
dict, optional) – Kwargs that are parsed to plot object.
- Returns:
The added plot object.
- Return type:
PlotFrame
- add_line(points: Iterable[Point | Vector], name: str | None = None, **kwargs: object) PlotBase
Add a sympy Vector to the scene.
- Parameters:
points (
listofsympy.physics.vector.point.Pointorsympy.physics.vector.vector.Vector) – The points or vectors through which the line should be plotted.name (
str, optional) – The name of the line. Default is None.**kwargs – Kwargs that are parsed to plot object.
- Returns:
The added plot object.
- Return type:
PlotLine
- add_plot_object(plot_object: PlotBase) None
Add a plot object to the scene.
- Parameters:
plot_object (
PlotBase) – The plot object that should be added.
- add_point(point: Point | Vector, **kwargs: object) PlotBase
Add a sympy Vector to the scene.
- Parameters:
point (
sympy.physics.vector.point.Pointorsympy.physics.vector.vector.Vector) – The point or vector to be plotted as point in space.**kwargs – Keyword arguments are parsed to the plot object.
- Returns:
The added plot object.
- Return type:
PlotPoint
- add_point_trace(point: Point | Vector, frequency: int = 1, alpha_decays: Callable[[np.ndarray[np.int64]], np.ndarray[np.float64]] | None = None, **kwargs: object) PlotBase
Add a traced point to the scene.
- Parameters:
point (
sympy.physics.vector.point.Pointorsympy.physics.vector.vector.Vector) – The point or vector to be traced in space.frequency (
int, optional) – Frequency to log the point with. Default is 1 (shows every point).alpha_decays (
callable, optional) – Function that returns the transparency of a point based on the number of evaluations since it was logged. This input is an array of integers representing the age of each logged point, and the output should be an array of floats between 0 and 1 representing the alpha values. If None, no transparency decay is applied. Default is None. Hint: you can use np.vectorize to vectorize a function for this purpose.**kwargs – Keyword arguments are parsed to the plot object.
- Returns:
The added plot object.
- Return type:
PlotTracedPoint
- add_vector(vector: Vector, origin: Point | Vector | None = None, **kwargs: object) PlotBase
Add a sympy Vector to the scene.
- Parameters:
vector (
sympy.physics.vector.vector.Vector) – The vector that should be plotted with respect to the zero_point.origin (
sympy.physics.vector.point.Point,sympy.physics.vector.vector.Vector, optional) – The origin of the reference frame. Default is the zero_point.**kwargs (
dict, optional) – Kwargs that are parsed to the plot object.
- Returns:
The added plot object.
- Return type:
PlotVector
- animate(get_args: Callable[[object], tuple], frames: Iterable[object] | int, interval: int = 30, **kwargs: object) FuncAnimation
Animate the scene.
- Parameters:
get_args (
Callable) – Function that returns the arguments for theevaluate_systemmethod. The function should takes the current frame as input.frames (
intoriterable) – Number of frames or iterable with frames.interval (
int, optional) – Time interval between frames in milliseconds. Default is 30.**kwargs – Keyword arguments are parsed to the
matplotlib.animation.FuncAnimation.
- Returns:
Animation object.
- Return type:
- property annot_coords: tuple[float, float]
Coordinate where the annotation text is displayed.
- property annot_location: str
String describing where the annotation should be displayed.
Explanation
String that is used to determine where the annotation should be displayed. Options are: - ‘object’: The annotation location is determined based on the plot_object
- property artists: tuple[ArtistBase, ...]
Artists used to plot the object.
- as_orthogonal_projection_plot(frame: ReferenceFrame | None = None) None
Change the axis to an orthogonal projection making the view seemingly 2D.
- Parameters:
frame (
sympy.physics.vector.frame.ReferenceFrame, optional) – Reference frame w.r.t. which the axis view is oriented aligning the users view with its YZ plane. The default is the inertial frame of the scene.
- auto_zoom(scale: float = 1.1) tuple[float, float] | None
Auto scale the axis.
- clear() None
Clear the axes.
Explanation
Remove all artists known by the instance. Only the inertial frame as plotobject in the scene.
- evaluate_system(*args: object) None
Evaluate the system using the function created with
lambdify_system.
- get_expressions_to_evaluate() tuple
Return a tuple of the necessary expressions for plotting.
- get_plot_object(sympy_object: object | str) PlotBase | None
Return the plot_object based on a sympy object.
Explanation
Return the
plot_objectbased on a provided sympy object. For exampleReferenceFrame('N')will give thePlotFrameof that reference frame. If theplot_objecthas not been added it will returnNone.- Parameters:
sympy_object (
objectorstr) – SymPy object to search for. If it is a string it will search for the name.- Returns:
Retrieved plot object.
- Return type:
PlotBaseorNone
- property inertial_frame: sympy.physics.vector.frame.ReferenceFrame
The reference frame with respect to which all objects will be oriented.
- lambdify_system(args, modules=None, printer=None, use_imps=True, dummify=False, cse=True) Callable
Lambdify the system.
Explanation
Lambdify the system for faster evaluation, when combined with
symmeplot.core.scene.SceneBase.evaluate_system(). Seesympy.utilities.lambdify.lambdify()for more information.
- plot(prettify: bool = True, ax_scale: float = 1.5) None
Plot all plot objects.
- Parameters:
prettify (
bool, optional) – If True prettify the axes. Default is True.ax_scale (
float, optional) – Makes the axes bigger in the figure. This function is part of prettifying the figure and only works nicely if it is the only subplot. Disabled if set to 0. Default is 1.5
- Returns:
Returns the plotted artists
- Return type:
tupleofartists
- set_visibility(sympy_object: object | str, is_visible: bool, raise_error: bool = True) None
Hide or show a
plot_objectbased on asympy_object.- Parameters:
sympy_object (
sympy.physics.vector.point.Pointorsympy.physics.vector.vector.Vectororsympy.physics.vector.frame.ReferenceFrameorsympy.physics.mechanics.particle.Particleorsympy.physics.mechanics.rigidbody.RigidBodyorstr) – SymPy object to show or hide.is_visible (
bool) – If True showplot_object, otherwise hide plot_object.raise_error (
bool, optional) – If plot_object not found raise an error. Default is True.
- update() None
Update the objects on the scene, based on the current values.
- property values: tuple
List of evaluated values for the object’s variables.
- property zero_point: sympy.physics.vector.point.Point
The absolute origin with respect to which all objects will be positioned.